
In our introductory article on using Outreg2 for regression output, we learnt how to output Stata regression output into other file formats like Word, Excel or Latex and how we could adjust the layout of the output tables. In this second section of our two-part article on the outreg2 command, we explore how additional statistics, beyond the default output, can be reported. To read part 1 of the article on the outreg2 command, click here.
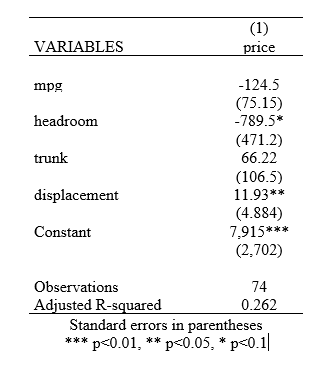
Reporting Adjusted R-squared in regression output
To enhance the usefulness of the command, outreg2 also comes with certain options to customise the statistics we need it to report. If, for example, we wish to report the adjusted R-squared (instead of R-squared), we use the adjr2 option.
regress price mpg headroom trunk displacement
outreg2 using results, word replace adjr2
If we do not want any of the R-squared value reported, we specify the nor2 option:
outreg2 using results, word replace nor2
Removing Number of Observations
Be default, the output table shows the number of observations for each regression column. If we do not want the number of observations reported, the option of noobs removes the statistic from the table:
outreg2 using results, word replace noobs
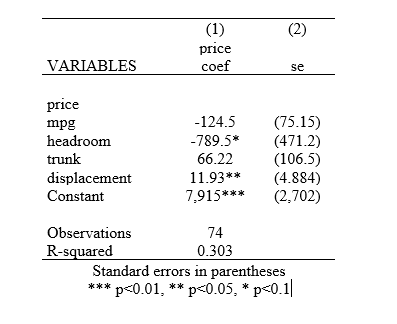
Sideways Reporting of Standard Errors
The option sideway reports the standard errors in a separate column beside the regression coefficients instead of underneath them.
outreg2 using results, word replace sideway
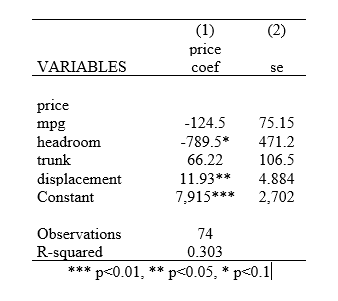
To further remove parentheses from these sideways standard errors, we add the noparen option:
outreg2 using results, word replace sideway noparen
Excluding Standard Errors
If we do not want standard errors to be reported at all, we just specify the nose option.
outreg2 using results, word replace nose
Reporting Additional Statistics: addstat & stat
By default, outreg2 outputs the coefficients, their standard errors, R-squared and the number of observations in the table. To add more statistics, we need to specify an option called addstat() with the names and macros of each new statistic that we require typed inside the parenthesis. For example:
outreg2 using results, word replace addstat("F-Stat",e(F),"Prob > F",e(p),"Degree of Freedom",e(df_r))
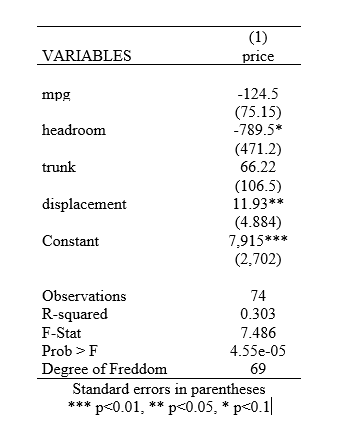
To explain the syntax inside the addstat() parenthesis, let’s digress a little into scalars. After every regression, Stata stores values of different statistical measures in temporary variables called scalars. These variables get populated with certain regression output statistics each time we run a regression. For example, e(N) stores the number of observations, while e(r2) stores the R-squared of the regression that was previously run. A list of these scalars and what they store can be accessed by running the command:
ereturn list
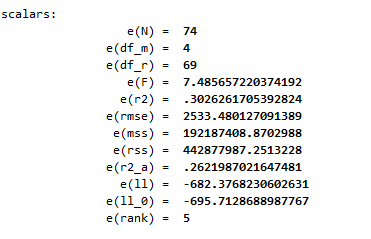
Or a comprehensive list of them is also present in Stata’s documentation for the regress command which can be read under “Stored Results” via:
help regress
In our example, we make use of these scalars and report the F-stat stored in e(F), Prob > F stored in e(p), and degrees of freedom stored on e(df_r). Stata is then able to refer to the values stored in these scalars and output them in the table.
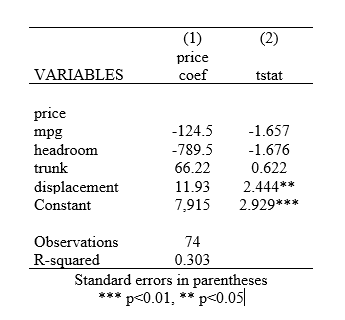
Several other statistics can be reported using the stat() option. These include, among others, t-stats, p-values, confidence intervals, and standardised beta.
outreg2 using results, word replace stat(coef beta se ci) sideway
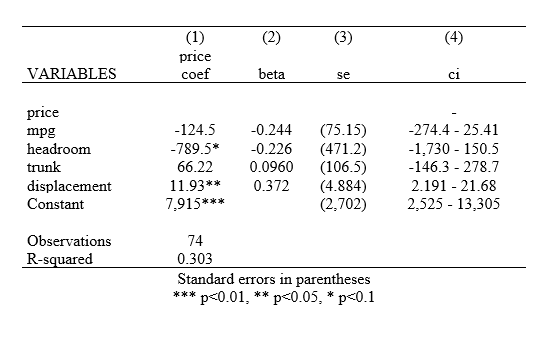
The option of sideway ensures that these statistics are reported in a separate column each.
Specifying Confidence Intervals and Significance Levels
By default, Stata sets the confidence intervals at 95% for every regression. To have specific levels of confidence intervals reported, we use the level() option.
outreg2 using results, word replace stat(coef ci) sideway level(90)
Significance levels can also be similarly specified. By default, Stata reports significance levels of 10%, 5% and 1%. We can further tailor this through the alpha() option:
outreg2 using results, word replace stat(coef tstat) sideway alpha(0.01, 0.05)
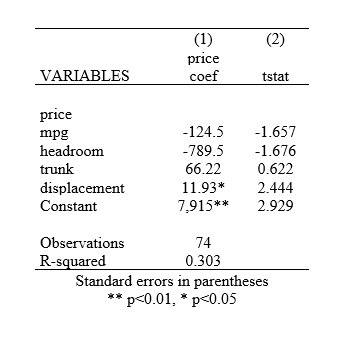
The above command would report only the 1% and 5% significance levels. No asterisk will be added for a 10% significance level.
If we wish to specify the number of asterisks to be reported for each significance level, we follow the alpha() option with the symbol() option:
outreg2 using results, word replace stat(coef tstat) sideway alpha(0.01, 0.05) symbol(***, **)
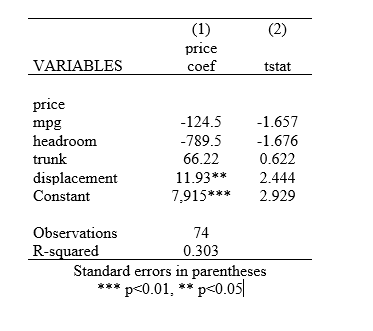
This ensures that two and three asterisks are used to symbolise significance levels of 5% and 1% respectively. Stata adjusts its note at the bottom of the table accordingly.
If we desire for the asterisks to appear beside t-stats instead of the coefficients, we specify asterisk(tstat) as an option.
outreg2 using results, word replace stat(coef tstat) sideway alpha(0.01, 0.05) symbol(***, **) asterisk(tstat)
Or we can remove the asterisks altogether using the noaster option
outreg2 using results, word replace noaster
Keeping/Dropping Variables from the Output Table
If we only wish to retain some of the independent variables in our output table of regressions, we can use the keep() option to specify (in the parenthesis) which of these variables we want reported. Alternatively, we can use the drop() option to indicate (in the parenthesis) which ones we want omitted. This comes in particularly useful when we have fixed effect dummy variables in our regression models.
regress price mpg headroom trunk displacement
outreg2 using results, word replace keep(mpg trunk)
OR
outreg2 using results, word replace drop(headroom displacement)
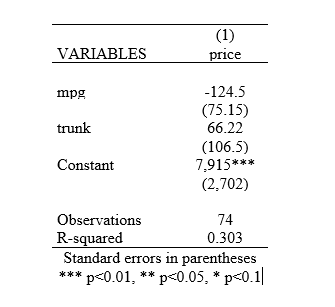
So, even though our regression was performed using four independent variables, the keep() or drop() options ensure that the output table only has results for ‘mpg’ and trunk‘.